Crypto Tracker Tutorial with Real-Time Charts
Today's cryptocurrency market is growing rapidly. Adding a real-time crypto tracker to your website could be beneficial. Not only could it attract new users, but it could also keep your current users engaged.
If you're a developer seeking to broaden your skills, this tutorial could be a valuable resource. It's not just about creating a real-time crypto tracker. You'll also learn how to incorporate charts into your application.
To make the most of it, I suggest you try coding along with the tutorial.
What are we going to build?
Let's first understand what we're aiming to create from today's tutorial.
Our app will feature two pages. The first page, our homepage, will showcase a list of today's trending coins. It will display seven coins, each with its image and market cap compared to Bitcoin.
![]()
Moreover, it will have a search option, allowing users to find any coin.
![]()
When a user clicks on a specific coin, they will be redirected to the second page. Here, they'll find comprehensive details about the chosen coin and three types of graphs. These graphs will show the coin's value over time.
This might seem challenging at first, but once you start working on it, you'll see how easy it can be. Now, let's explore the technologies we'll be using in this tutorial.
Technologies used
We're using React, a frontend library, to design our user interface.
React is a JavaScript library developed by Facebook. Its purpose is to build user interfaces. It allows developers to create reusable UI components. This makes building and maintaining complex user interfaces simpler. React's component-based design ensures efficient rendering of dynamic, interactive content.
In addition to React, we're using a special API called Coingeko API to fetch coin data. This API is a strong, user-friendly tool. Developers can use it to access cryptocurrency data. It provides real-time and historical information on various cryptocurrencies. This includes prices, market capitalization, and trading volumes. The API integrates easily into apps and services. Users can stay updated on the latest crypto market developments.
Lastly, we're using a library called ReCharts to create charts in our app. ReCharts is a simple, lightweight JavaScript library. Developers can use it to make attractive, interactive charts for web pages. It supports various chart types like line, bar, pie, and more. This lets you visualize data easily. With ReCharts, adding dynamic charts to your web apps is simple and hassle-free.
That's it for the technologies. Now, let's start building our application without any further delay.
Creating the React app and Installing the Dependencies
First of all, we need to create a React application for this project. You might have used 'create-react-app' to build React applications in the past. If that's the case, you're in for a treat with this tutorial because we'll be learning something new and improved. Instead of using 'create-react-app', we'll use Vite to build our React app. Vite offers several benefits over create-react-app. Those are
-
Efficient Development Server: Vite includes its own development server, offering faster reloads and better performance.
-
No Bundling during Development: Vite, unlike CRA, doesn't bundle code during development, enabling smoother and quicker development.
-
Optimized Production Build: Vite uses Rollup for production builds, leading to smaller bundles and better loading times.
-
Configurable: Vite provides more configuration options, giving experienced developers more control over their projects.
How to create a React application using Vite?
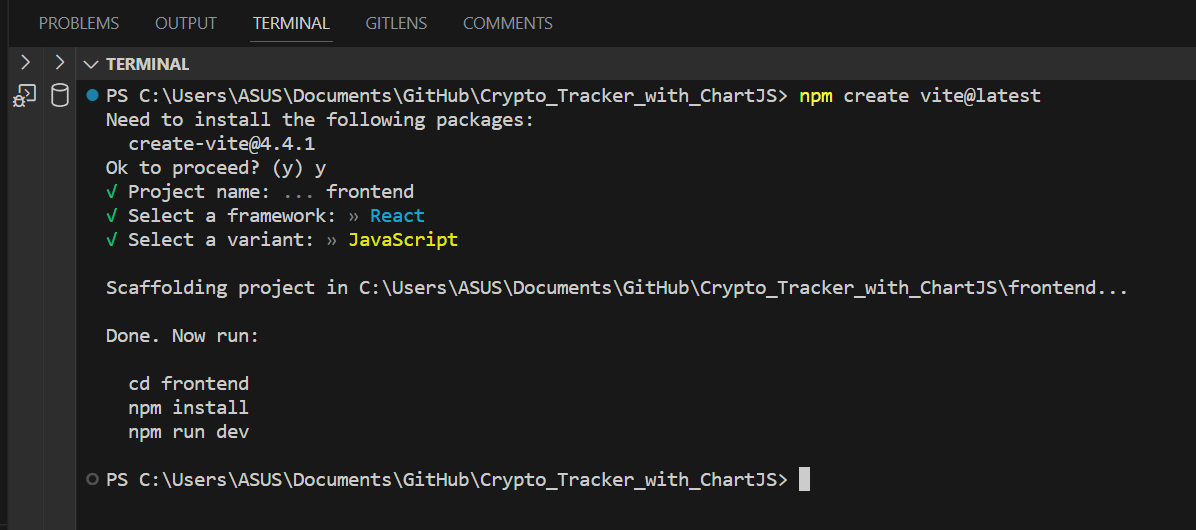
First, open up your terminal and type the following command:
npm create vite@latest
This will prompt a series of messages in your terminal.
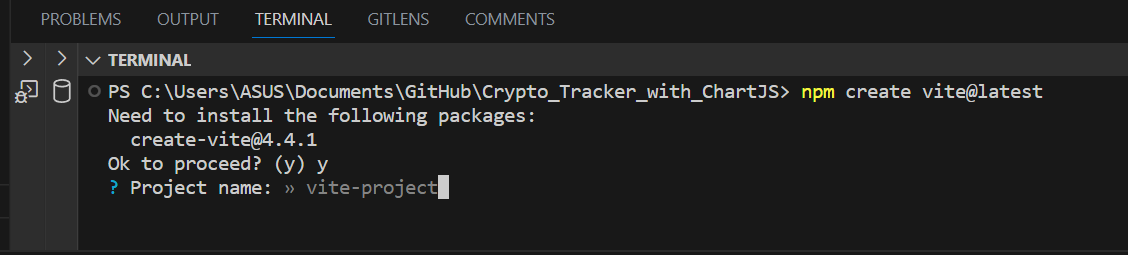
Next, you'll need to provide a name for your project. Let's name it "frontend" (or choose any other name you prefer).
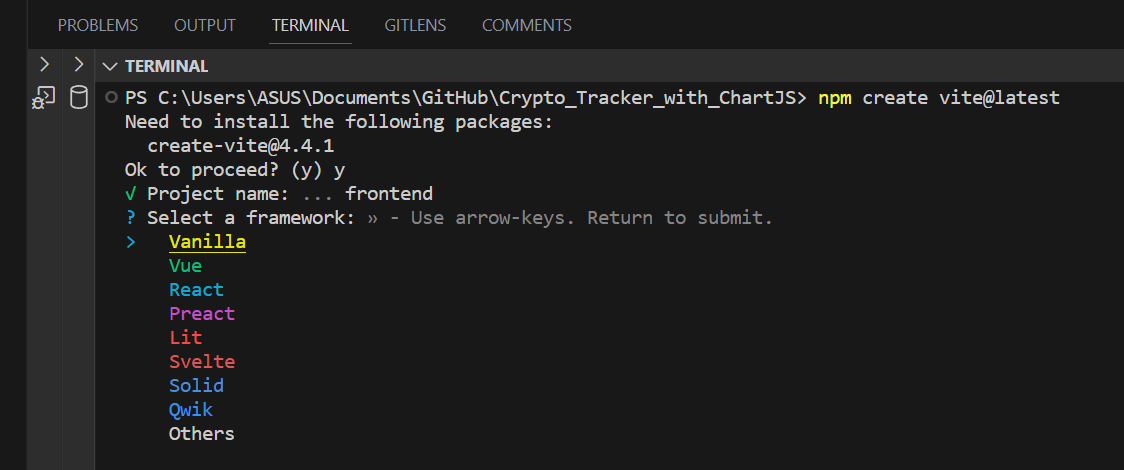
After naming your project, you'll be presented with several options. You can navigate through these options using the up and down arrow keys on your keyboard. Find "React" and press enter to create the application with React.
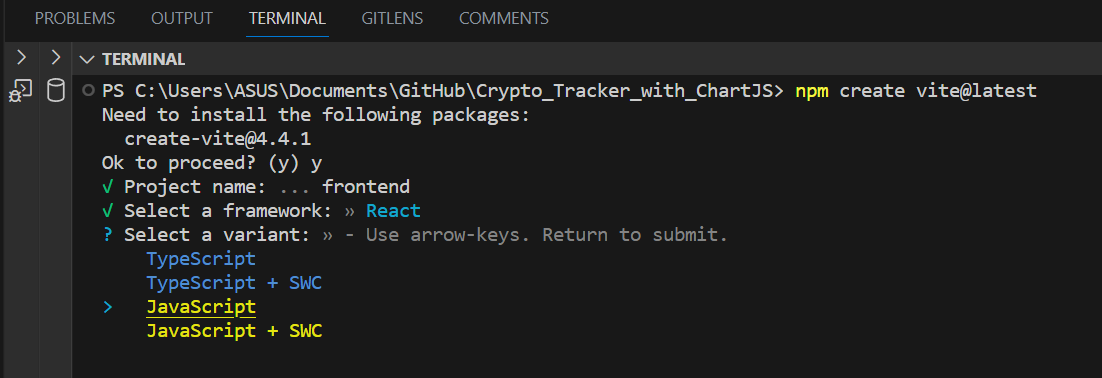
Next, you'll need to select "JavaScript". We are using ReactJs in this tutorial, so press enter to confirm your selection.
After the installation process, you'll be prompted to navigate to the newly created project folder and install all necessary dependencies for your React application.
To do this, first navigate to the "frontend" folder by typing the following command:
cd frontend
Then install the dependencies by typing
npm install
Once the installation is finished, type npm run dev and click on the provided link. This will take you to your new React application.
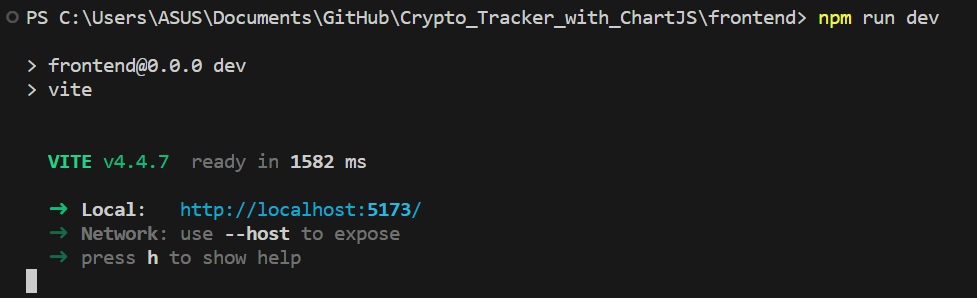
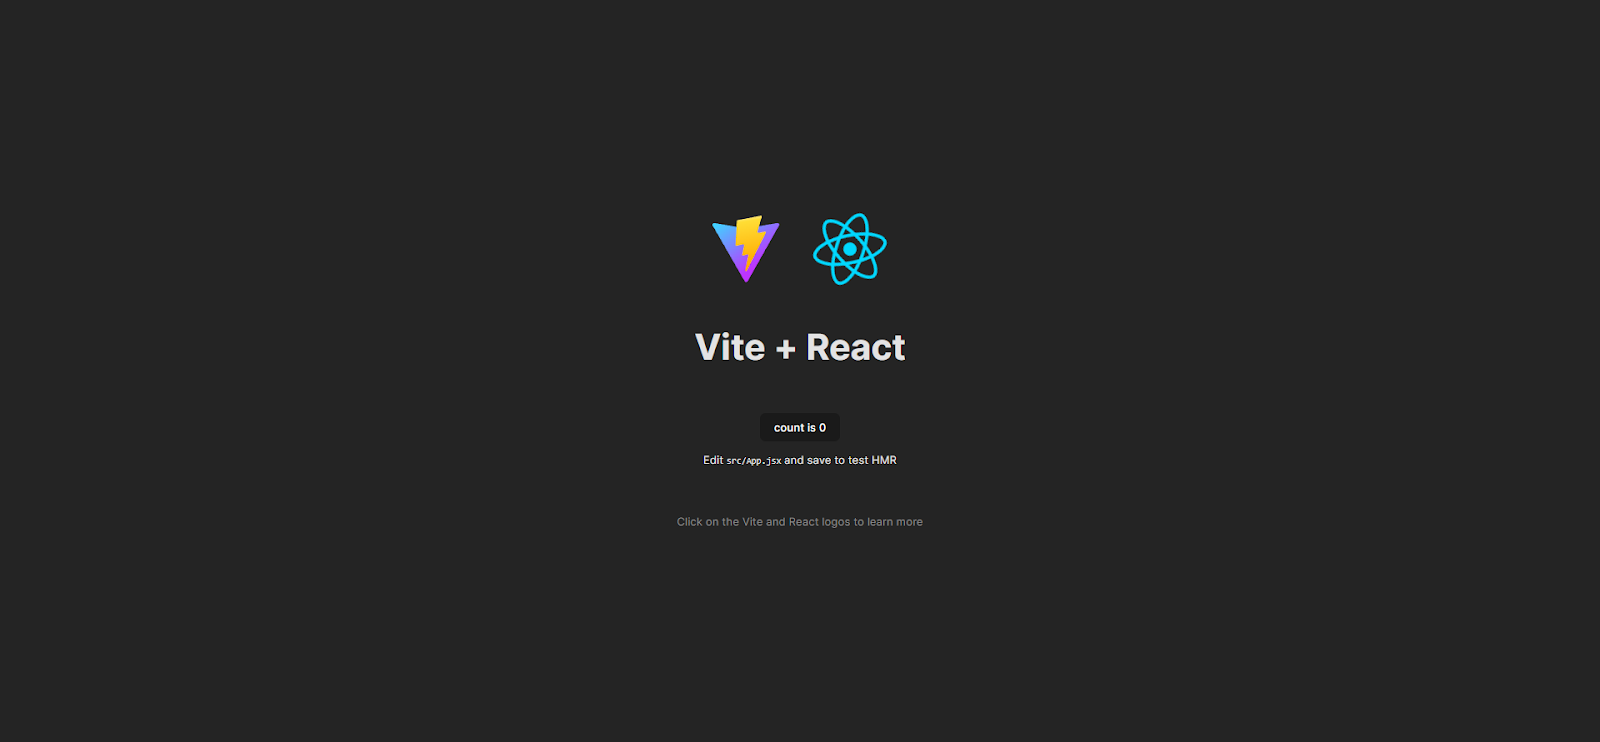
And that's it, we have now created the React application!
Installing the Dependencies
While the React application is running in the current terminal, let's open a new terminal to install all our dependencies.
Navigate to your terminal and type.
npm install react-router-dom axios sass zustand
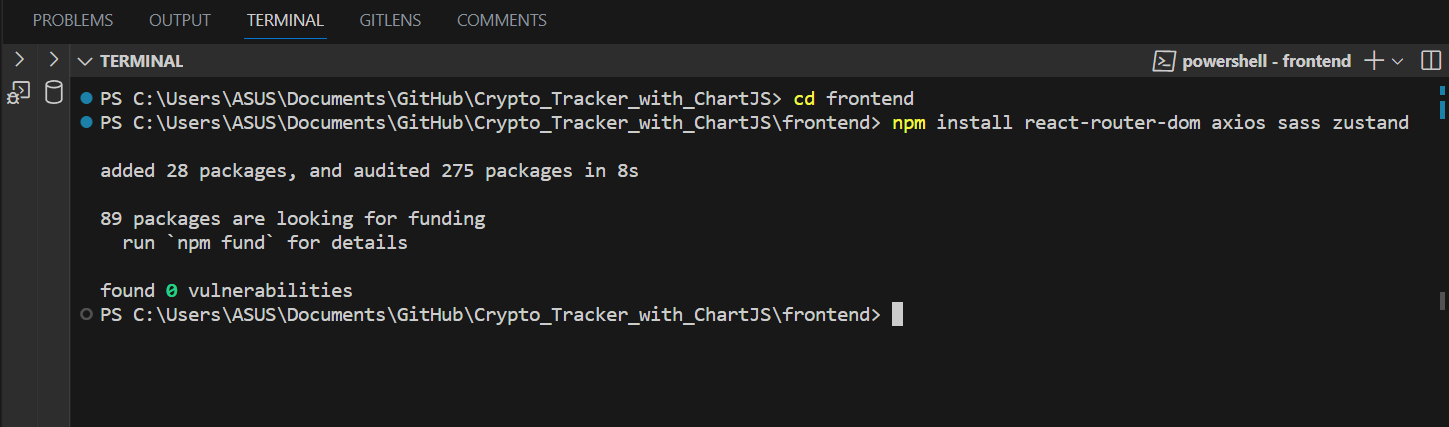
- react-router-dom: This package allows navigation between different views and components in a single-page React application. It helps manage routes and handle different URLs.
- axios: Axios is a JavaScript library for making HTTP requests. It simplifies sending and handling asynchronous HTTP requests.
- sass: SASS, a CSS preprocessor, enhances CSS with features like variables, nested rules, and mixins. It aids in writing maintainable, organized CSS code for complex projects.
- zustand: Zustand is a state management library for React. It provides a simple, minimalistic approach to managing application state, reducing the need for complex setups.
Creating the folder structure
We won't be using the App.jsx, App.css, and index.css files. So, you can remove them from your 'src' folder.
We will have a 'components' folder to store all our components, a 'store' folder to manage our global states, and a 'pages' folder to organize our two pages.
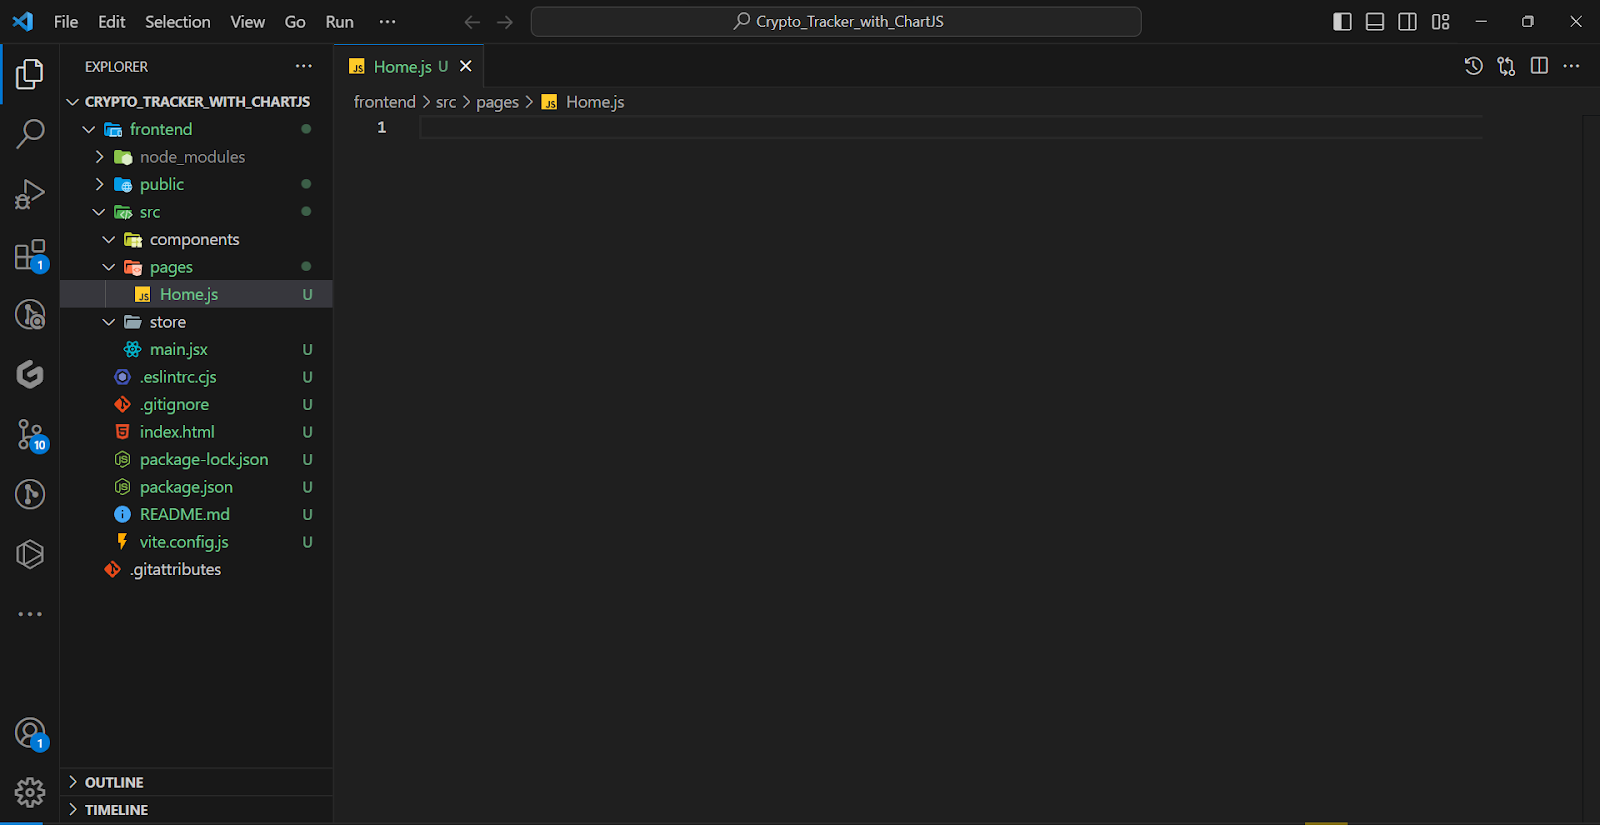
Next, create a file named Home.js in the 'pages' folder. This will serve as our homepage, featuring the trending coins and other elements we discussed earlier.
Then well type rfc and press tab to create this code snippet.
import React from 'react';

export default function Home() {
  return (
    <div>
      Home
    </div>
  );
}
This is an extension in vs code that is really useful. The extension is called ES7+ React/Redux/React-Native snippets. Install it and you are good to go.
Then Let’s create the other page where there are the information and the charts related to a single coin.
Create a new file in pages and name it as Show.jsx. Go to the file and hit rfc then tab. You’ll end up with something like this.
import React from 'react';

export default function Show() {
  return (
    <div>
      Show
    </div>
  );
}
Creating Routes
Let's go to main.jsx and set up the routes for our application.
First, clear everything in main.jsx and paste the following code
import ReactDOM from "react-dom/client";
import { BrowserRouter, Route, Routes } from "react-router-dom";
import Home from "./pages/Home";
import Show from "./pages/Show";

ReactDOM.createRoot(document.getElementById("root")).render(
  <BrowserRouter>
    <Routes>
      <Route path="/" element={<Home />} />
      <Route path="/:id" element={<Show />} />
    </Routes>
  </BrowserRouter>
);
In this code, we've set up two routes for our application. If the route is 'http://localhost:5173/', the Home page will be displayed. If the route is 'http://localhost:5173/id', the Show page will be displayed. It's as simple as that.
Fetching Data from the CoinGecko API
In this step, we'll create a state store for our Home page using Zustand, a state management library. Zustand allows us to manage the states of our application globally. This means we can use and modify these states in any component across the application by simply importing the store.
In the context of our application, the state we are interested in is the list of trending coins, which we represent as an array of coin objects.
Start by creating a new file homeStore.jsx inside the 'store' folder and add the following code.
import { create } from "zustand";
import axios from "axios";

const homeStore = create((set) => ({
  coins: [],

  fetchCoins: async () => {
    const res = await axios.get("https://api.coingecko.com/api/v3/search/trending");
    const coins = res.data.coins.map((coin) => {
      return {
        id: coin.item.id,
        name: coin.item.name,
        image: coin.item.large,
        priceBtc: coin.item.price_btc.toFixed(10),
      };
    });

    console.log(coins);
    set({ coins });
  },
}));

export default homeStore;
As you can see our coins have properties such as name, image and price against BTC.
We also define an asynchronous function fetchCoins inside the store. This function is responsible for fetching the list of trending coins from the CoinGecko API and updating our coins state with the retrieved data.
Displaying Coins on the Home Page
Once we have our store set up, we can import it into Home.js and use the state and functions defined in the store.
Here is the updated Home.js code
import React, { useEffect } from "react";
import homeStore from "../store/homeStore";
import { Link } from "react-router-dom";

export default function Home() {
  const store = homeStore();

  useEffect(() => {
    store.fetchCoins();
  }, []);

  return (
    <div>
      {store.coins.map((coin) => {
        return (
          <div key={coin.id}>
            <div>{coin.name}</div>
          </div>
        );
      })}
    </div>
  );
}
In this code,
-
We import homeStore and use it to get access to our coins state and fetchCoins function.
-
Within a useEffect hook, we call fetchCoins. This ensures that fetchCoins is executed once when the component mounts, which fetches the list of trending coins from the API and updates our coins state.
-
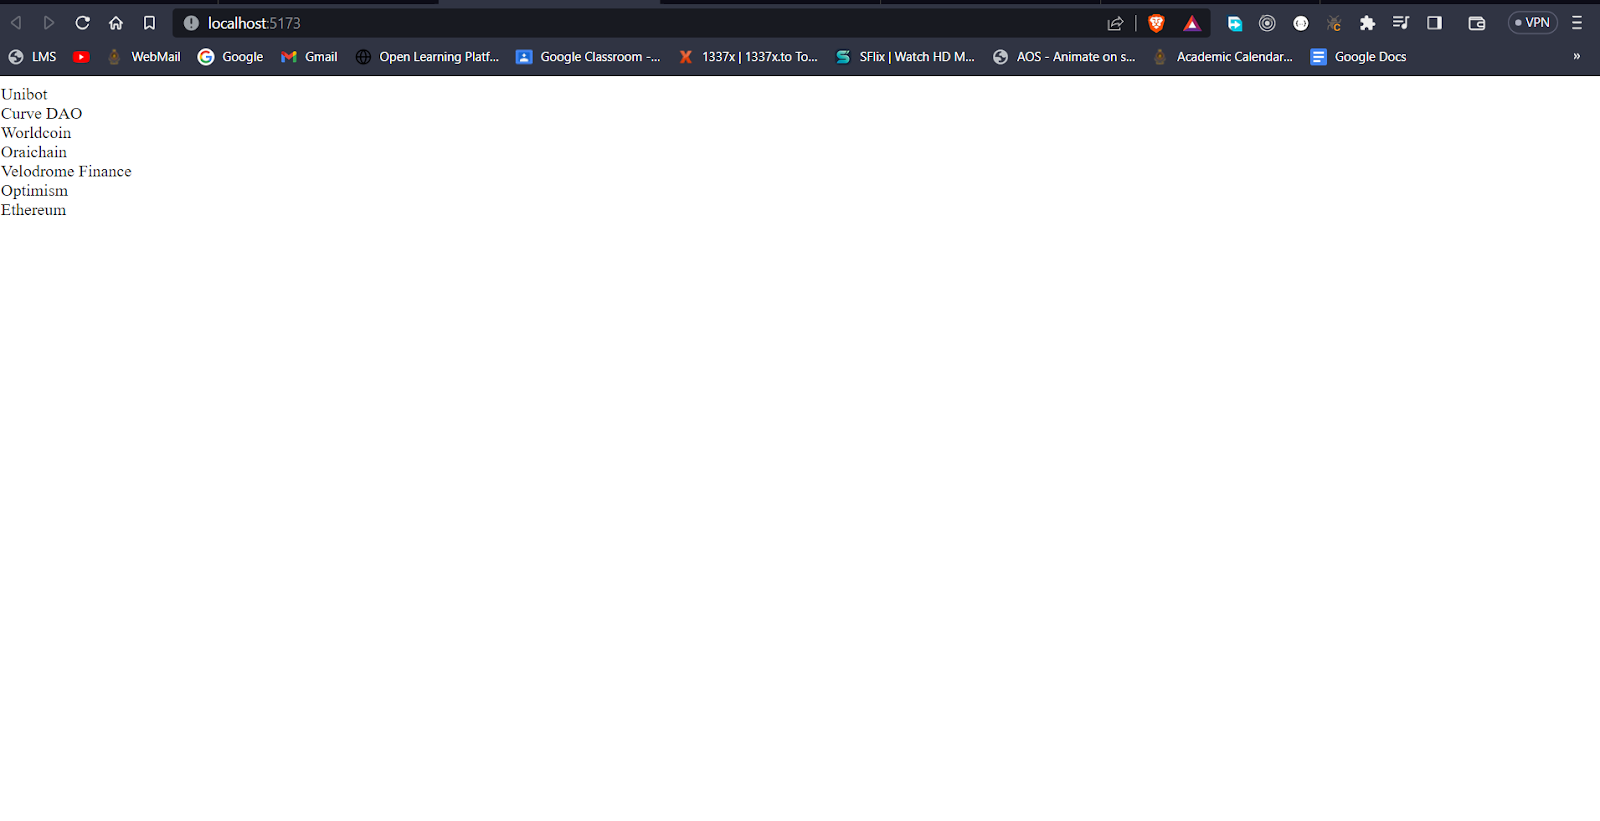
In the return statement of the component, we map over the coins array to display each coin's name on the page.
Implementing Search Functionality
In this section, we will add a search functionality to our application, allowing users to search for a specific cryptocurrency coin. The goal is to display the search results in real-time as the user types into the search bar. To avoid excessive API calls and enhance user experience, we'll implement a debounce function. This function will delay the execution of the search until the user has stopped typing for a certain period of time.
Creating the Debounce Function
A debounce function is used to prevent a particular function from being called immediately. Instead, it ensures the function only gets called after the user has stopped invoking the function for a specific amount of time. In our case, we will use this function to delay the API call until the user has stopped typing.
Create a new folder inside the 'src' folder named 'helpers', and create a new file inside it named 'debounce.js'. Add the following code in 'debounce.js'.
export default function debounce(func, wait, immediate) {
  var timeout;

  return function () {
    var context = this,
      args = arguments;

    var later = function () {
      timeout = null;
      if (!immediate) func.apply(context, args);
    };

    var callNow = immediate && !timeout;

    clearTimeout(timeout);
    timeout = setTimeout(later, wait);

    if (callNow) func.apply(context, args);
  };
}
You can learn more about debounce functions online for a deeper understanding. For now, just know that it helps us limit the rate of execution of our search function.
Updating the Home Store
Let's update our homeStore.js file to include the search functionality.
import { create } from "zustand";
import axios from "axios";
import debounce from "../helpers/debounce";

const homeStore = create((set) => ({
  coins: [],
  trending: [],
  query: "",

  setQuery: (e) => {
    set({ query: e.target.value });
    homeStore.getState().searchCoins();
  },

  searchCoins: debounce(async () => {
    const { query, trending } = homeStore.getState();

    if (query.length > 2) {
      const res = await axios.get(
        `https://api.coingecko.com/api/v3/search?query=${query}`
      );
      const coins = res.data.coins.map((coin) => {
        return {
          name: coin.name,
          image: coin.large,
          id: coin.id,
        };
      });
      set({ coins });
    } else {
      set({ coins: trending });
    }
  }, 500),

  fetchCoins: async () => {
    const res = await axios.get(
      "https://api.coingecko.com/api/v3/search/trending"
    );
    const coins = res.data.coins.map((coin) => {
      return {
        id: coin.item.id,
        name: coin.item.name,
        image: coin.item.large,
        priceBtc: coin.item.price_btc.toFixed(10),
      };
    });
    console.log(coins);
    set({ coins, trending: coins });
  },
}));

export default homeStore;
In this revised code, we've introduced two new state variables - trending and query. The former keeps track of the list of trending coins, while the latter captures the user's search input.
The setQuery function has been enhanced to not only take the user's input as an argument and update the query state but also to trigger the searchCoins function. The real magic happens in the searchCoins function, which is now enveloped by a debounce function with a 500 millisecond delay. This function checks the length of the user's search query. If the query is more than two characters, it sends an API request to fetch coins that match the query. On the contrary, if the query is two or fewer characters, it reverts the coins state back to trending, showing the trending coins.
Finally, the fetchCoins function has been updated to simultaneously set both coins and trending states with the fetched list of trending coins. This allows for the trending array to reset the coins array when needed.
Updating the Frontend
Finally, to tie the search functionality to the frontend, we need to update the input box in our component like this.
<input
  type="text"
  placeholder="Search"
  value={store.query}
  onChange={store.setQuery}
/>
Here, value={store.query} binds the input box's value to the query state in homeStore. When the value of the input box changes (i.e., the user types something), we call the store.setQuery function to update our query state and initiate a search.
Creating the Coin Info page
In this next phase, we aim to construct a page displaying detailed information about a chosen coin. This information will be available once a coin is clicked.
Constructing the showStore.jsx
To start, we'll create another store named showStore.jsx to handle data specific to this page. The following code will be included in this store.
import { create } from "zustand";
import axios from "axios";

const showStore = create((set) => ({
 graphData: [],
 fetchData: async (id) => {
   const [graphsRes, dataRes] = await Promise.all([
     axios.get(
       `https://api.coingecko.com/api/v3/coins/${id}/market_chart?vs_currency=usd&days=100&interval=daily&precision=2`
     ),
     axios.get(
       `https://api.coingecko.com/api/v3/coins/${id}?localization=true&tickers=true&market_data=true&community_data=true&developer_data=true&sparkline=true`
     ),
   ]);

   const graphData = graphsRes.data.prices.map((price) => {
     const [timeStamp, priceValue] = price;
     const date = new Date(timeStamp).toLocaleDateString("en-us");
     return {
       Date: date,
       Price: priceValue,
     };
   });

   console.log(dataRes);

   set({
     data: dataRes.data, // Set the fetched data to `store.data`
     graphData,
   });
 },
}));

export default showStore;
This page intends to display two types of data.
-
A graph representing the coin's price over time
-
Basic information about the selected coin
We need two API calls to retrieve this information. These requests are simultaneously made using Promise.all() to optimize loading time.
The fetchData function is responsible for making these API calls and storing the results in the graphData array and data object.
For the graph, we use the 'market_chart' endpoint to get price and date data. We then map over the graphsRes.data.prices array to transform the timestamp into a more readable date format and construct the graphData array.
Installing and Using Recharts
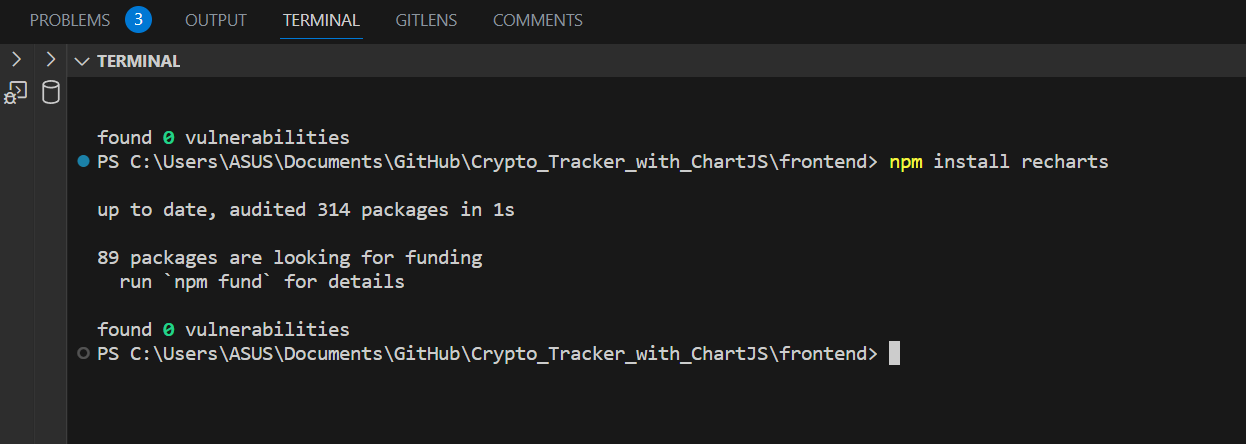
To render the charts on our page, we'll use a React chart library called Recharts. This can be installed by running the following command in your terminal.
npm install recharts
In our show.jsx page, we plan to show three different charts from which the user can choose to view any at a given time.
What is chackraUI and how to use it in our react app?
Chakra UI is a robust, user-friendly library of React components that can greatly enhance your React project. It provides a comprehensive set of customizable, accessible UI components that allow developers to quickly build beautiful and responsive user interfaces. Chakra UI emphasizes on accessibility, ensuring your web app is usable by all users, including those with disabilities. Let's discuss how to install and implement Chakra UI in your React project.
Installing Chakra UI
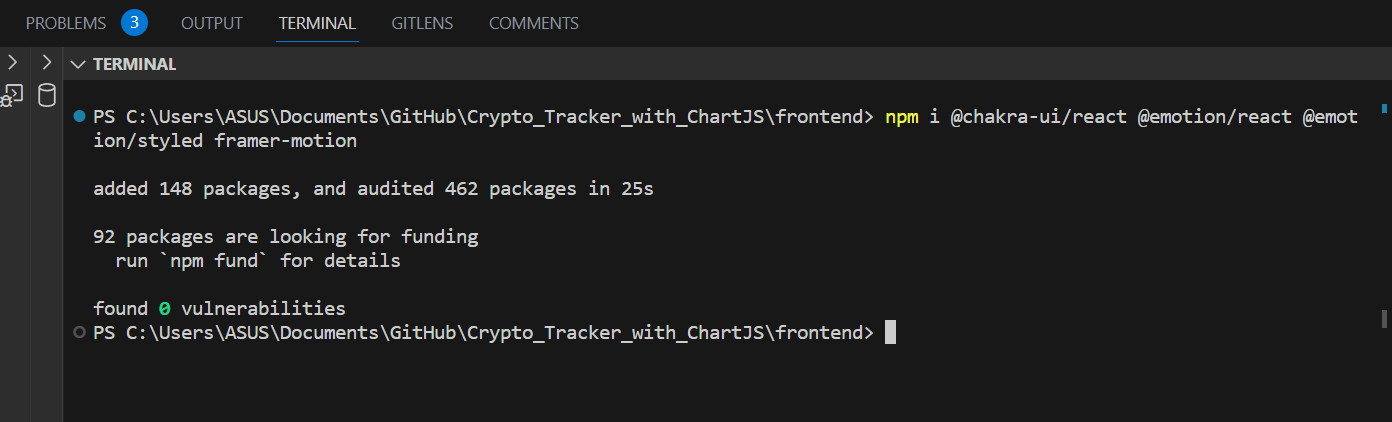
To install Chakra UI, open your terminal and type the following.
npm i @chakra-ui/react @emotion/react @emotion/styled framer-motion
Implementing Chakra UI in Your Project
After installing Chakra UI, it's time to incorporate it into your project. We need to wrap our entire application with the
import ReactDOM from "react-dom/client";
import { BrowserRouter, Route, Routes } from "react-router-dom";
import Home from "./pages/Home";
import Show from "./pages/Show";
import { ChakraProvider } from "@chakra-ui/react";

ReactDOM.createRoot(document.getElementById("root")).render(
  <BrowserRouter>
    <ChakraProvider>
      <Routes>
        <Route path="/" element={<Home />} />
        <Route path="/:id" element={<Show />} />
      </Routes>
    </ChakraProvider>
  </BrowserRouter>
);
In the code snippet above, we imported ChakraProvider and wrapped the routes inside it. With this setup, you're ready to use Chakra UI's components in your project.
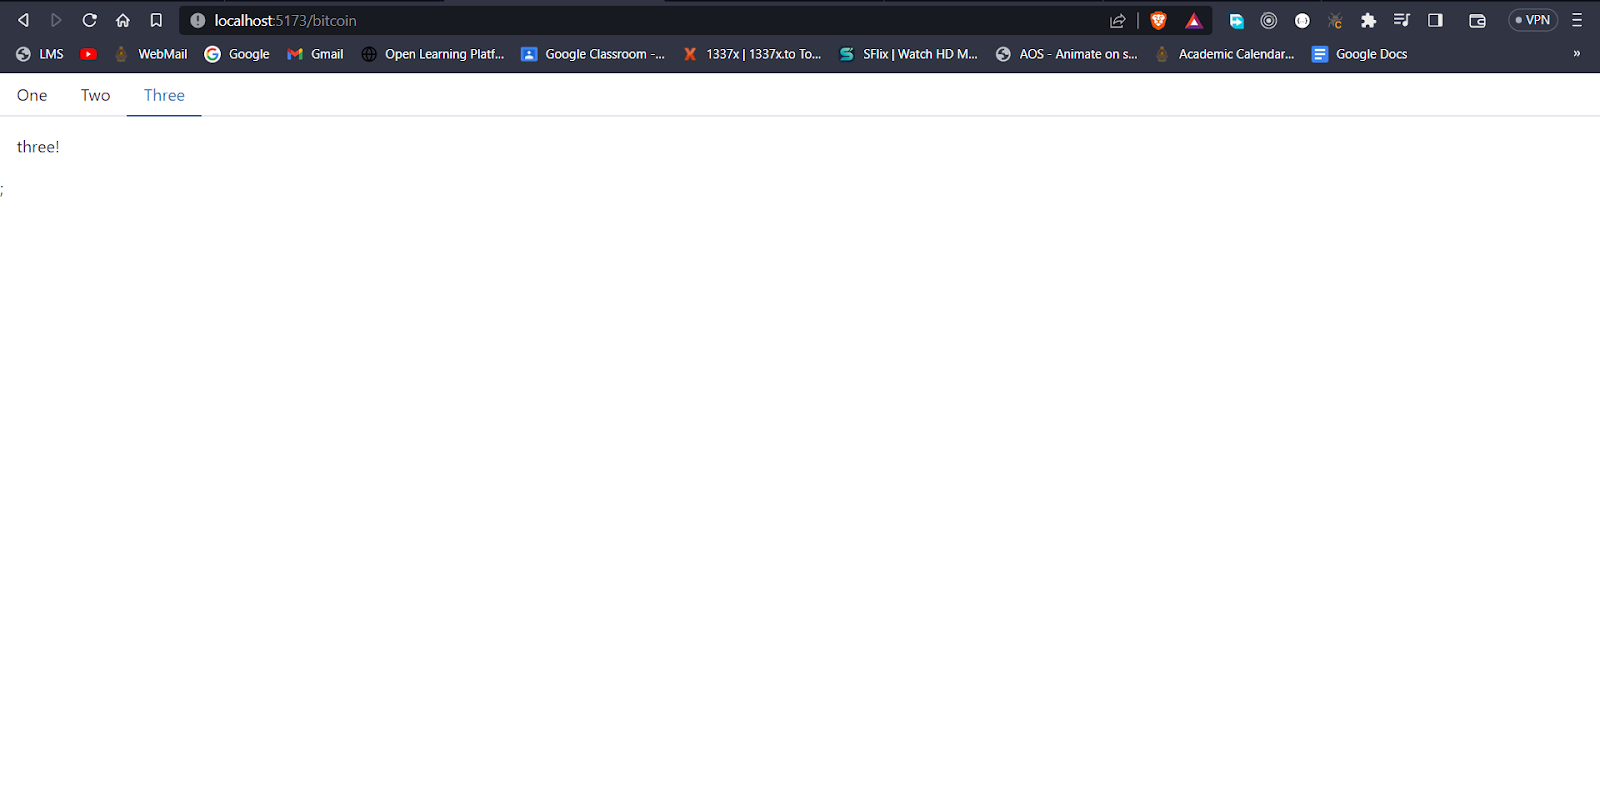
Working with the Tabs Component in Chakra UI
Here's an example of how to use the Tabs component in Chakra UI.
<Tabs>
  <TabList>
    <Tab>Line Chart</Tab>
    <Tab>Bar Chart</Tab>
    <Tab>Area Chart</Tab>
  </TabList>
  <TabPanels>
    <TabPanel>
      <p>one!</p>
    </TabPanel>
    <TabPanel>
      <p>two!</p>
    </TabPanel>
    <TabPanel>
      <p>three!</p>
    </TabPanel>
  </TabPanels>
</Tabs>;
In this example, the Tabs component contains multiple Tab and TabPanel components. Each Tab corresponds to a TabPanel.
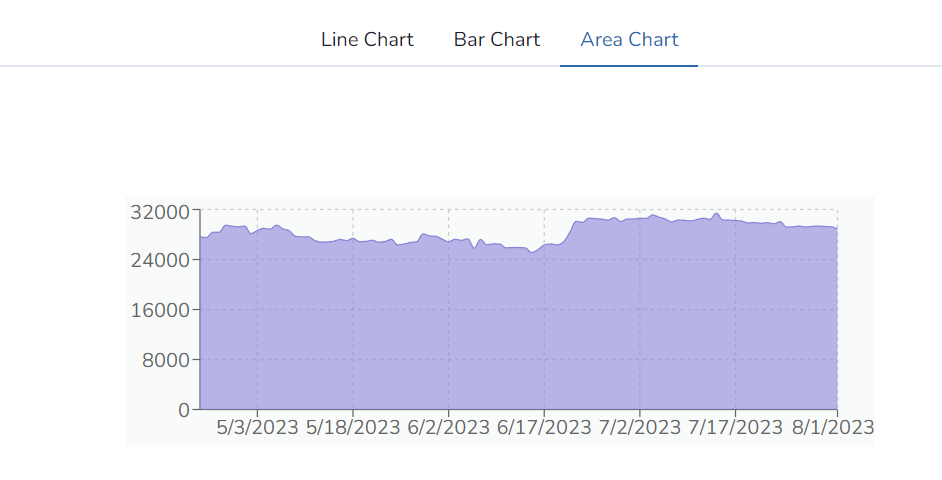
Incorporating Graphs into the Tab Panels
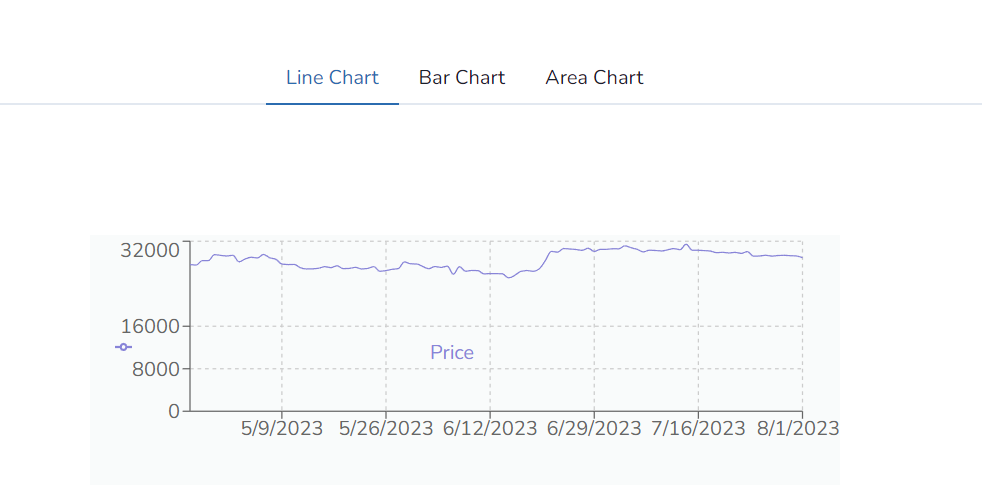
To visualize the data, we can incorporate different types of charts within the TabPanel components. The following code snippet demonstrates how to do this.
import { useEffect } from "react";
import showStore from "../store/showStore";
import { useParams } from "react-router-dom";
import { Tab, TabList, TabPanel, TabPanels, Tabs } from "@chakra-ui/react";
import {
  XAxis,
  YAxis,
  CartesianGrid,
  Tooltip,
  ResponsiveContainer,
  LineChart,
  Line,
  Legend,
} from "recharts";

export default function Show() {
  const store = showStore();
  // to get the coin id from the url
  const params = useParams();

  useEffect(() => {
    store.fetchData(params.id);
  }, []);

  return (
    <div>
      <Tabs>
        <TabList>
          <Tab>Line Chart</Tab>
          <Tab>Bar Chart</Tab>
          <Tab>Area Chart</Tab>
        </TabList>

        <TabPanels>
          <TabPanel>
            <div className="width">
              <div className="show-graph">
                <ResponsiveContainer width="100%" height={300}>
                  <LineChart
                    width={500}
                    height={300}
                    data={store.graphData}
                    margin={{
                      top: 5,
                      right: 30,
                      left: 20,
                      bottom: 5,
                    }}
                  >
                    <CartesianGrid strokeDasharray="3 3" />
                    <XAxis dataKey="Date" />
                    <YAxis />
                    <Tooltip />
                    <Legend />
                    <Line type="monotone" dataKey="Price" stroke="#8884d8" />
                  </LineChart>
                </ResponsiveContainer>
              </div>
            </div>
          </TabPanel>

          <TabPanel>
            <p>two!</p>
          </TabPanel>

          <TabPanel>
            <p>three!</p>
          </TabPanel>
        </TabPanels>
      </Tabs>
    </div>
  );
}
In this code, we use the useEffect hook to fetch data from the store, and display a Line Chart inside the TabPanel. Note that we set the data prop of LineChart to store.graphData, which is the data fetched from the store.
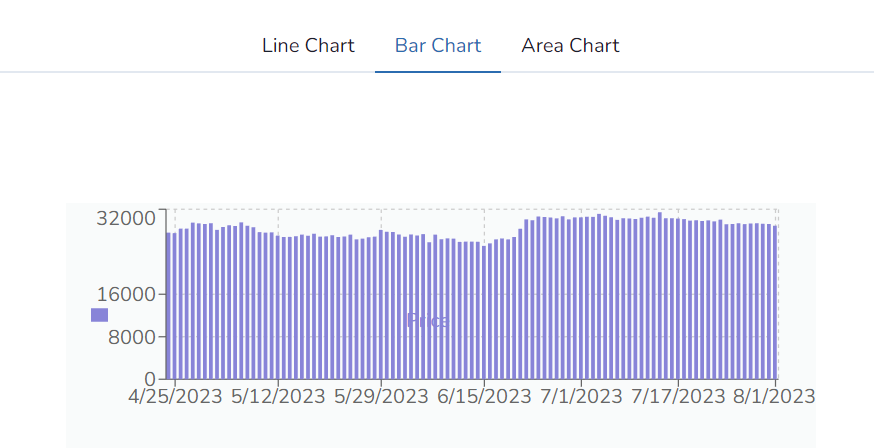
We can similarly add Bar and Area charts in the remaining TabPanel components.
<TabPanel>
  <div className="width">
    <div className="show-graph">
      <ResponsiveContainer width="100%" height="100%">
        <BarChart
          width={500}
          height={300}
          data={store.graphData}
          margin={{
            top: 5,
            right: 30,
            left: 20,
            bottom: 5,
          }}
        >
          <CartesianGrid strokeDasharray="3 3" />
          <XAxis dataKey="Date" />
          <YAxis />
          <Tooltip />
          <Legend />
          <Bar dataKey="Price" fill="#8884d8" />
        </BarChart>
      </ResponsiveContainer>
    </div>
  </div>
</TabPanel>

<TabPanel>
  <div className="width">
    <div className="show-graph">
      <ResponsiveContainer width="100%" height="100%">
        <AreaChart
          data={store.graphData}
          margin={{
            top: 10,
            right: 30,
            left: 0,
            bottom: 0,
          }}
        >
          <CartesianGrid strokeDasharray="3 3" />
          <XAxis dataKey="Date" />
          <YAxis />
          <Tooltip />
          <Area
            type="monotone"
            dataKey="Price"
            stroke="#8884d8"
            fill="#8884d8"
          />
        </AreaChart>
      </ResponsiveContainer>
    </div>
  </div>
</TabPanel>
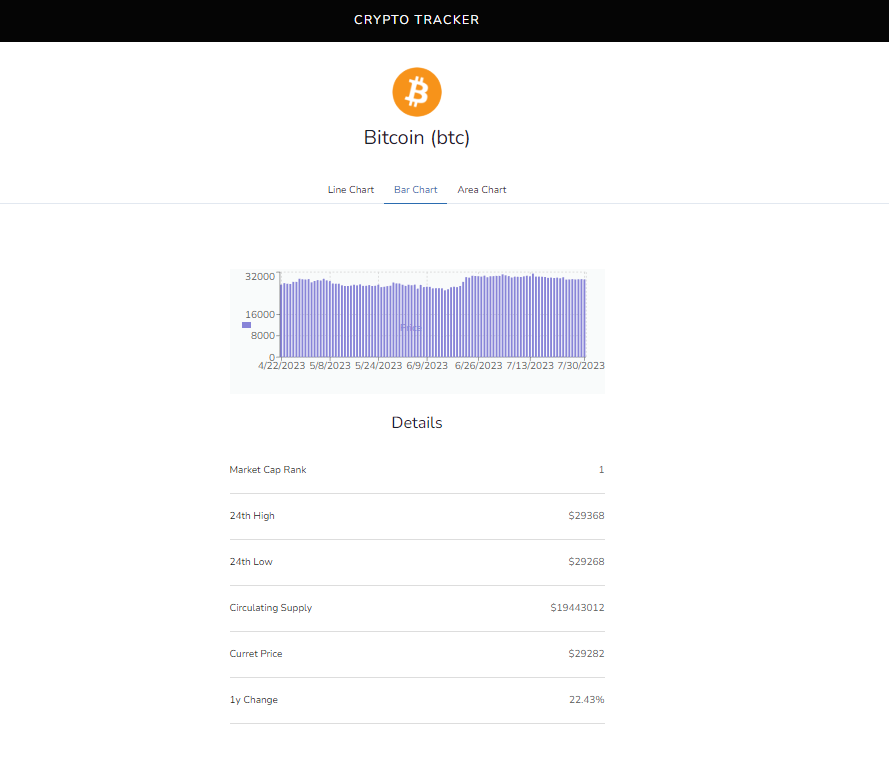
So the output will look like this.
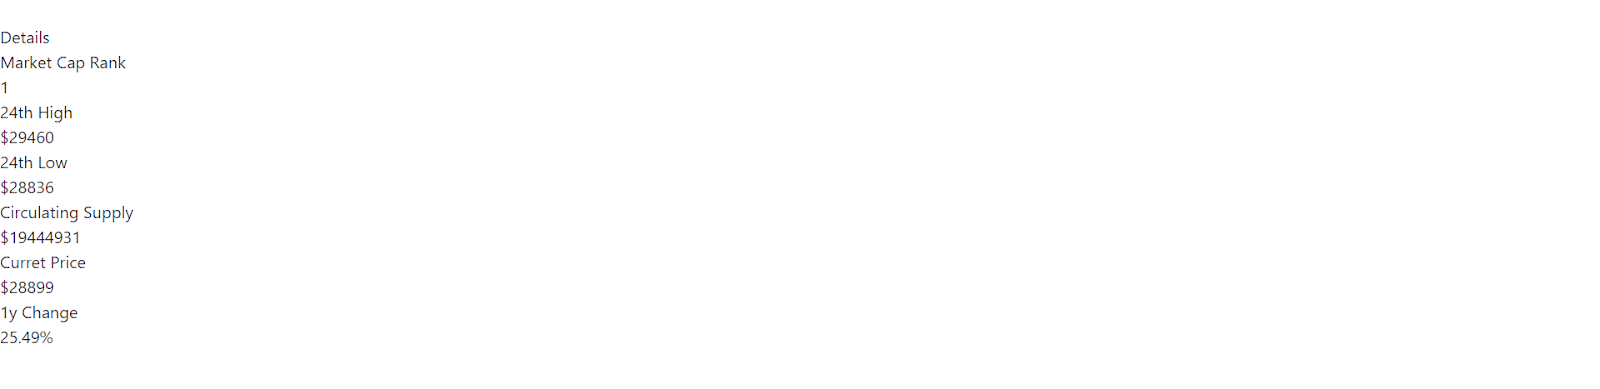
Displaying Coin Details
After retrieving the data from the API and setting it in the store, we can access the necessary fields using store.data.
<div className="show-details">
  <div className="width">
    <h2>Details</h2>
    <div className="show-details-row">
      <h4>Market Cap Rank</h4>
      <span>{store.data.market_cap_rank}</span>
    </div>
    <div className="show-details-row">
      <h4>24th High</h4>
      <span>${store.data.market_data.high_24h.usd}</span>
    </div>
    <div className="show-details-row">
      <h4>24th Low</h4>
      <span>${store.data.market_data.low_24h.usd}</span>
    </div>
    <div className="show-details-row">
      <h4>Circulating Supply</h4>
      <span>${store.data.market_data.circulating_supply}</span>
    </div>
    <div className="show-details-row">
      <h4>Current Price</h4>
      <span>${store.data.market_data.current_price.usd}</span>
    </div>
    <div className="show-details-row">
      <h4>1y Change</h4>
      <span>
        {store.data.market_data.price_change_percentage_1y.toFixed(2)}%
      </span>
    </div>
  </div>
</div>
This code will provide the following output.
We can also display the coin image and the coin name at the top of the page.
<header className="show-header">
  <img src={store.data.image.large} />
  <h2>
    {store.data.name} ({store.data.symbol})
  </h2>
</header>
In the code snippet above, store.data.image.large is the URL of the coin image, and store.data.name and store.data.symbol are the name and symbol of the coin, respectively. You willg et the following output from this code.
![]()
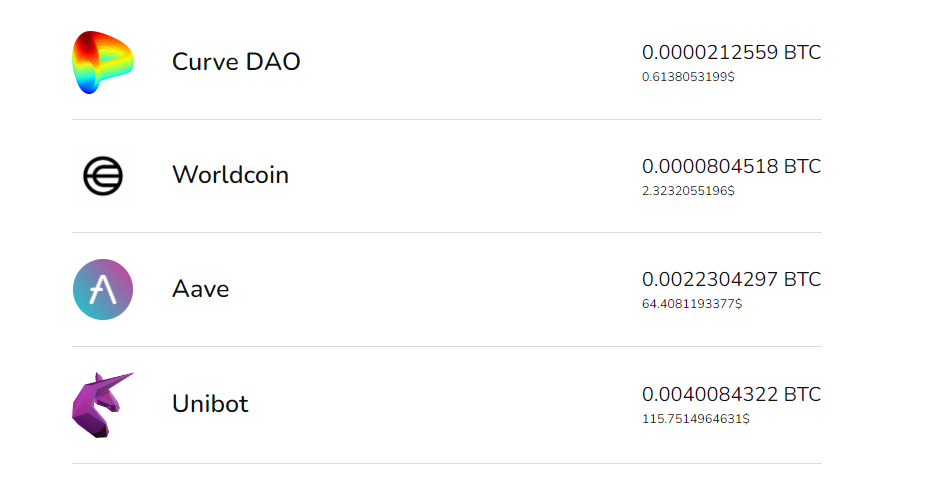
Making the Coin List Interactive
The focus of this section is on making the trending items list and the search list interactive. Specifically, we want to associate a link with each coin so that when clicked, the user is redirected to the relevant show.jsx page for that coin. This will require creating a new component which we'll name ListItems.jsx.
Creating the ListItems.jsx Component
Inside the components folder located in the src directory, let's create a new component, ListItems.jsx. Here's how the code looks.
import { Link } from "react-router-dom";

export default function ListItems({ coin }) {
  return (
    <div className="home-crypto">
      <Link to={`/${coin.id}`}>
        <span className="home-crypto-image">
          <img src={coin.image} />
        </span>
        <span className="home-crypto-name">{coin.name}</span>
        <span className="home-crypto-prices">
          <span className="home-crypto-btc">{coin.priceBtc} BTC</span>
          <span className="home-crypto-usd">{coin.priceUsd}$</span>
        </span>
      </Link>
    </div>
  );
}
In this component, we use the component from react-router-dom. The coin image is retrieved and displayed from . The coin name and prices (in both BTC and USD) are fetched and displayed using the and {coin.name} tags.
Incorporating ListItems Component into the Home View
The next step is to integrate this new ListItems component into the home.jsx file. Here's the updated code.
import { useEffect } from "react";
import homeStore from "../src/stores/homeStore";
import ListItems from "./components/ListItems";

export default function Home() {
  const store = homeStore();

  useEffect(() => {
    store.fetchCoins();
  }, []);

  return (
    <div>
      <header className="home-search">
        <div className="width">
          <h2>Search for a coin</h2>
          <div className="home-search-input">
            <input
              type="text"
              placeholder="Search"
              value={store.query}
              onChange={store.setQuery}
            />
          </div>
        </div>
      </header>
      <div className="home-cryptos">
        <div className="width">
          <h2> {!store.searched ? "Trending Coins" : "Searched Results"}</h2>
          {store.coins.map((coin) => {
            return <ListItems key={coin.id} coin={coin} />;
          })}
        </div>
      </div>
    </div>
  );
}
In the above code, we map through the coin array and for each coin, we return the ListItems component with coin.id and coin as props.
{store.coins.map((coin) => {
  return <ListItems key={coin.id} coin={coin} />;
})}
Implementing the Application Header
The last part of this step involves adding a header to our application. We will create a straightforward header with a black background and white text. Upon clicking the header text, the user will be redirected to the Home.jsx page.
Creating the Header.jsx Component
To implement this, we create a new file, Header.jsx, in the components folder. Here's how the code for Header.jsx looks.
import { Link } from "react-router-dom";

export default function Header({ back }) {
  return (
    <header className="header">
      <div className="width">
        <h1>
          <Link to="/">Crypto Tracker</Link>
        </h1>
      </div>
    </header>
  );
}
Like in the ListItems component, we use the component to navigate to the home page when the header text is clicked.
With these implementations, the core components of our application are ready. Finally, we need to focus on the styling to make our application visually appealing.
Final styling
In this section, we will finalize the look and feel of our application. To do so, create a new file named styles.scss in the src directory. Next, copy and paste the following code into this newly created file.
* {
  margin: 0;
  padding: 0;
  box-sizing: border-box;
  font-family: "Nunito", sans-serif;
}

input[type="text"] {
  -webkit-appearance: none;
  -moz-appearance: none;
  -ms-appearance: none;
  -o-appearance: none;
  appearance: none;
  border: none;
  outline: none;
  display: block;
  width: 100%;
  border-radius: 0%;
}

.width {
  max-width: 600px;
  margin: 0 auto;
  width: 92%;
  position: relative;
}

.header {
  background: #050505;
  color: white;
  padding: 20px 0;
  position: sticky;
  top: 0;
  z-index: 10;
}

h1 {
  text-align: center;
  color: white;
  text-transform: uppercase;
  font-size: 20px;
  letter-spacing: 2px;
}

h1 a {
  color: white;
}

a {
  text-decoration: none;
}

img {
  max-width: 100%;
  display: block;
}

svg {
  position: absolute;
  top: 50%;
  left: 0;
  margin-top: -12px;
  background-color: rgb(249, 251, 251);
}

.home-search {
  padding: 40px 0;
  text-align: center;
}

h2 {
  font-size: 32px;
  margin-bottom: 8px;
}

input {
  border: 1px solid #ddd;
  padding: 0 24px;
  border-radius: 8px;
  line-height: 54px;
}

.home-cryptos {
  h2 {
    font-size: 26px;
    margin-bottom: 20px;
    text-align: center;
    margin-bottom: 20px;
  }
}

.home-crypto {
  a {
    display: flex;
    gap: 30px;
    align-items: center;
    padding: 20px 0;
    border-bottom: 1px solid #ddd;
  }

  span {
    display: block;
  }
}

.home-crypto-image {
  width: 50px;
}

.home-crypto-name {
  flex: 1;
  font-size: 20px;
  color: #111;
  font-weight: 600;
}

.home-crypto-btc {
  font-size: 16px;
  color: #111;
}

.home-crypto-usd {
  font-size: 10px;
  color: #111;
}

.show-header {
  padding: 40px 0;
  text-align: center;
  font-size: 32px;

  img {
    width: 80px;
    border-radius: 50%;
    margin: 0 auto;
  }

  h2 {
    font-size: 32px;
    margin-top: 10px;
  }
}

.show-graph {
  height: 200px;
  width: 100%;
}

.show-details {
  padding-top: 100px;
  padding-bottom: 60px;

  h2 {
    font-size: 26px;
    margin-bottom: 20px;
    text-align: center;
    margin-bottom: 20px;
  }
}

.show-details-row {
  display: flex;
  align-items: center;
  justify-content: space-between;
  padding: 24px 0;
  border-bottom: 1px solid #ddd;
  color: #666;

  h4 {
    font-size: 16px;
    color: #111;
  }
}
The above style specifications should be quite straightforward to understand, so we won't delve into the specifics for each one.
Finally, import the style specifications into your main.jsx file using the following code.
import "./styles.scss";
Now everything is set, and your application should be good to go.
Final review of the code
As we said earlier, you can download this app from my GitHub repo. You can find all the files we developed here in that repository. Click the following links to get the final code of each file.
Conclusion
We've now successfully concluded our Real-Time Crypto Tracker with Real-Time Charts tutorial. To solidify your understanding of what we've covered, I encourage you to interact further with the Coindgecko API. By implementing different functionalities within this app or creating a completely new one, you can extend your learning.
Experimentation is a key part of mastery, so try incorporating more chart types and different data sets. The UI library we utilized in this tutorial is quite handy for front-end development practice, so don't hesitate to experiment with various components.
I hope this tutorial has proven insightful and educational. Looking forward to meeting you in the next tutorial!